


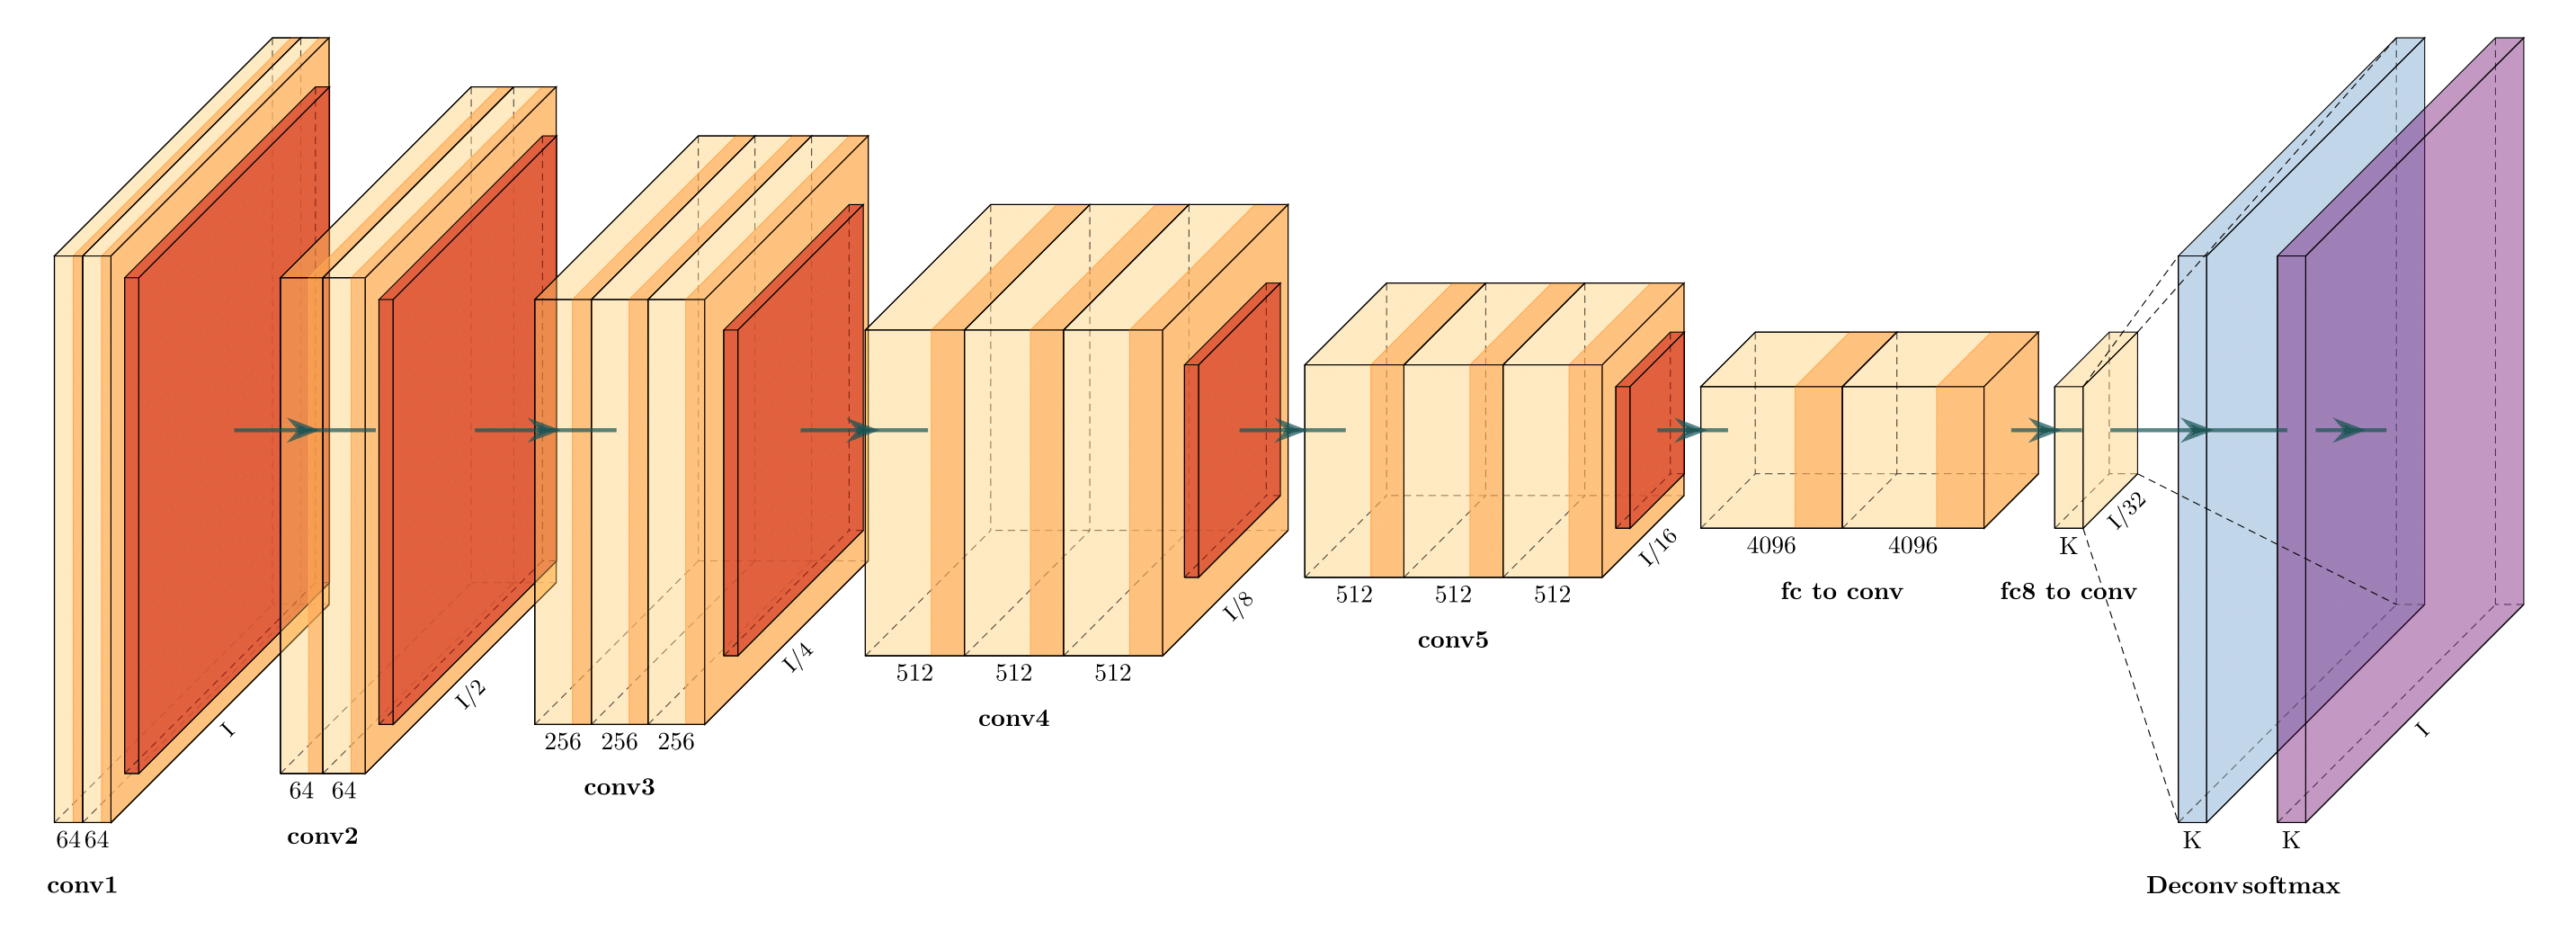
上面的神经网络图好看吧,这是怎么画出来的呢?今天给大家介绍一个牛逼的开源库,它提供了latex源码直接生成这样的神经网络图,开源库地址。
我们来看一下用法以及怎样修改源码来表达我们自己的网络。(下文默认使用的是Windows操作系统,其他操作系统的方式可以参考源码)
安装:
1)下载安装MikTeX,这个软件与Tex Studio一样,是一个latex的开发IDE,与tex studio的区别就是更加轻量,用到某个包时才下载该包。
2)安装一个bash runner,在windows上推荐git bash。什么是bash runner呢?经常用Linux的朋友都知道,在Linux上可以像这样执行指令: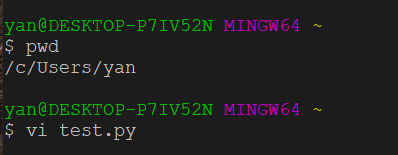
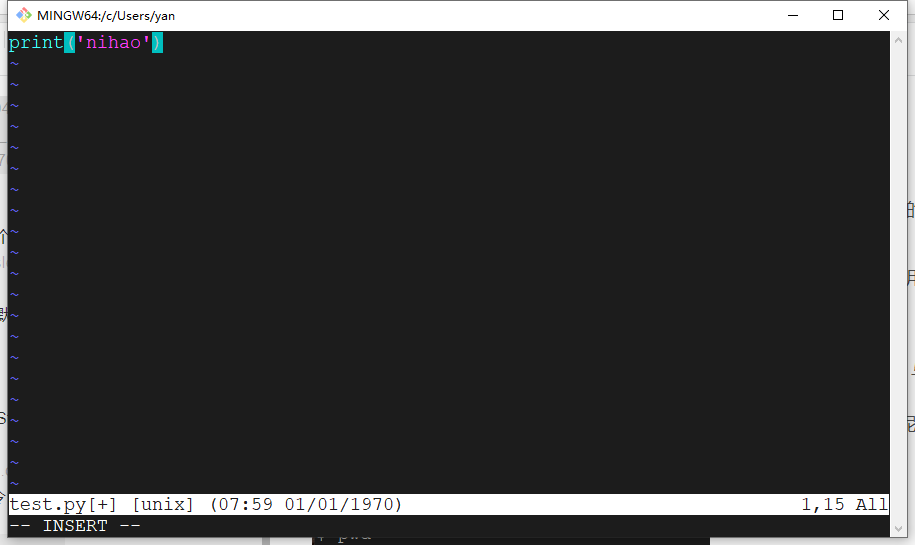
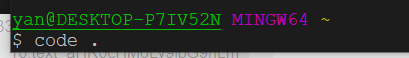
上面这几张图说了啥呢?在Linux里我们一切操作都在终端中完成,比如使用vim,执行code直接打开vscode,等等。但是在windows的powershell里,很多指令是不支持的。所以对于又想使用Linux终端的便利性,又要使用Windows的用户怎么办呢?
大家注意,我上面截屏的操作就是在Windows下完成的,就是git bash软件,这个软件模拟出了一个Linux终端的执行环境,可以像使用Linux一样无缝的在Windows中体验Linux终端的便利性。
除了这种方式,在Windows上使用Linux的另一种方式就是使用wsl系统了,wsl2就是一台真正的Linux虚拟机,而且可以完全共享硬件,所以也是不错的选择,对于Linux重度用户,可以选择安装wsl。
我们在这里,只是为了能够使用Linux的命令执行,所以装git bash就可以了。
上面两个安装步骤完成之后,我们将这个仓库的源码clone下来。直接在git bash里面使用git clone指令就行。
git clone https://github.com/HarisIqbal88/PlotNeuralNet.git
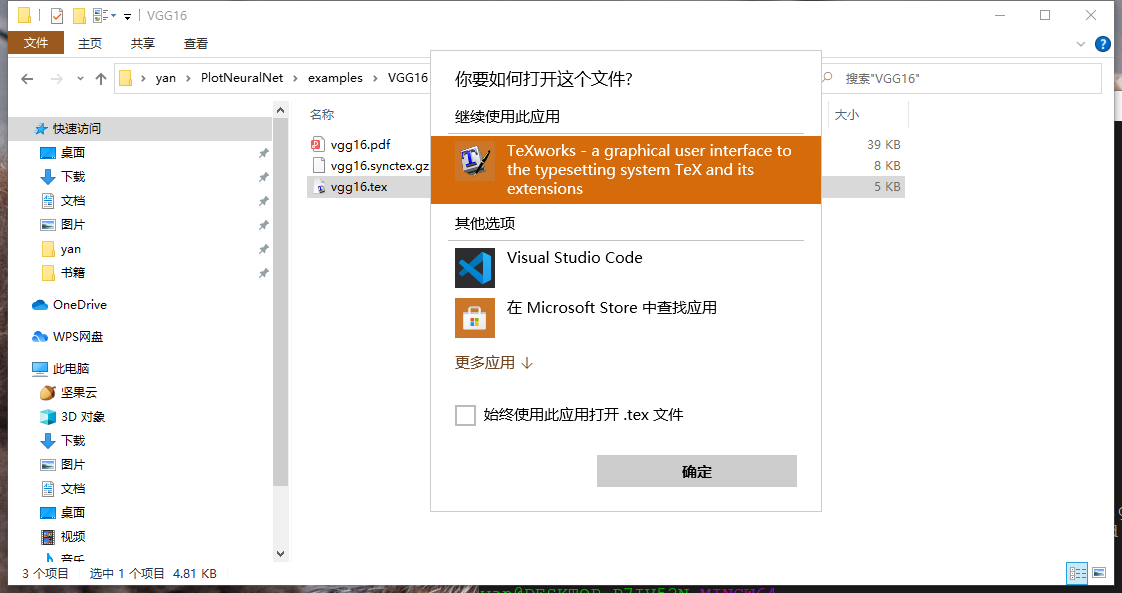
然后在资源管理器中找到这个目录的这个文件,双击使用TexWorks打开。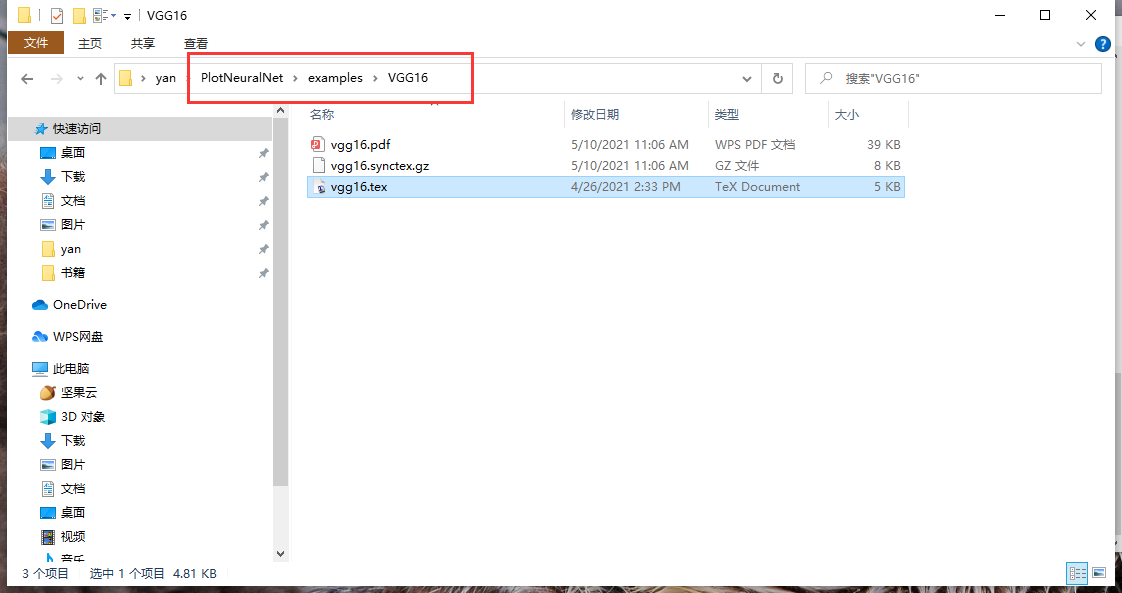
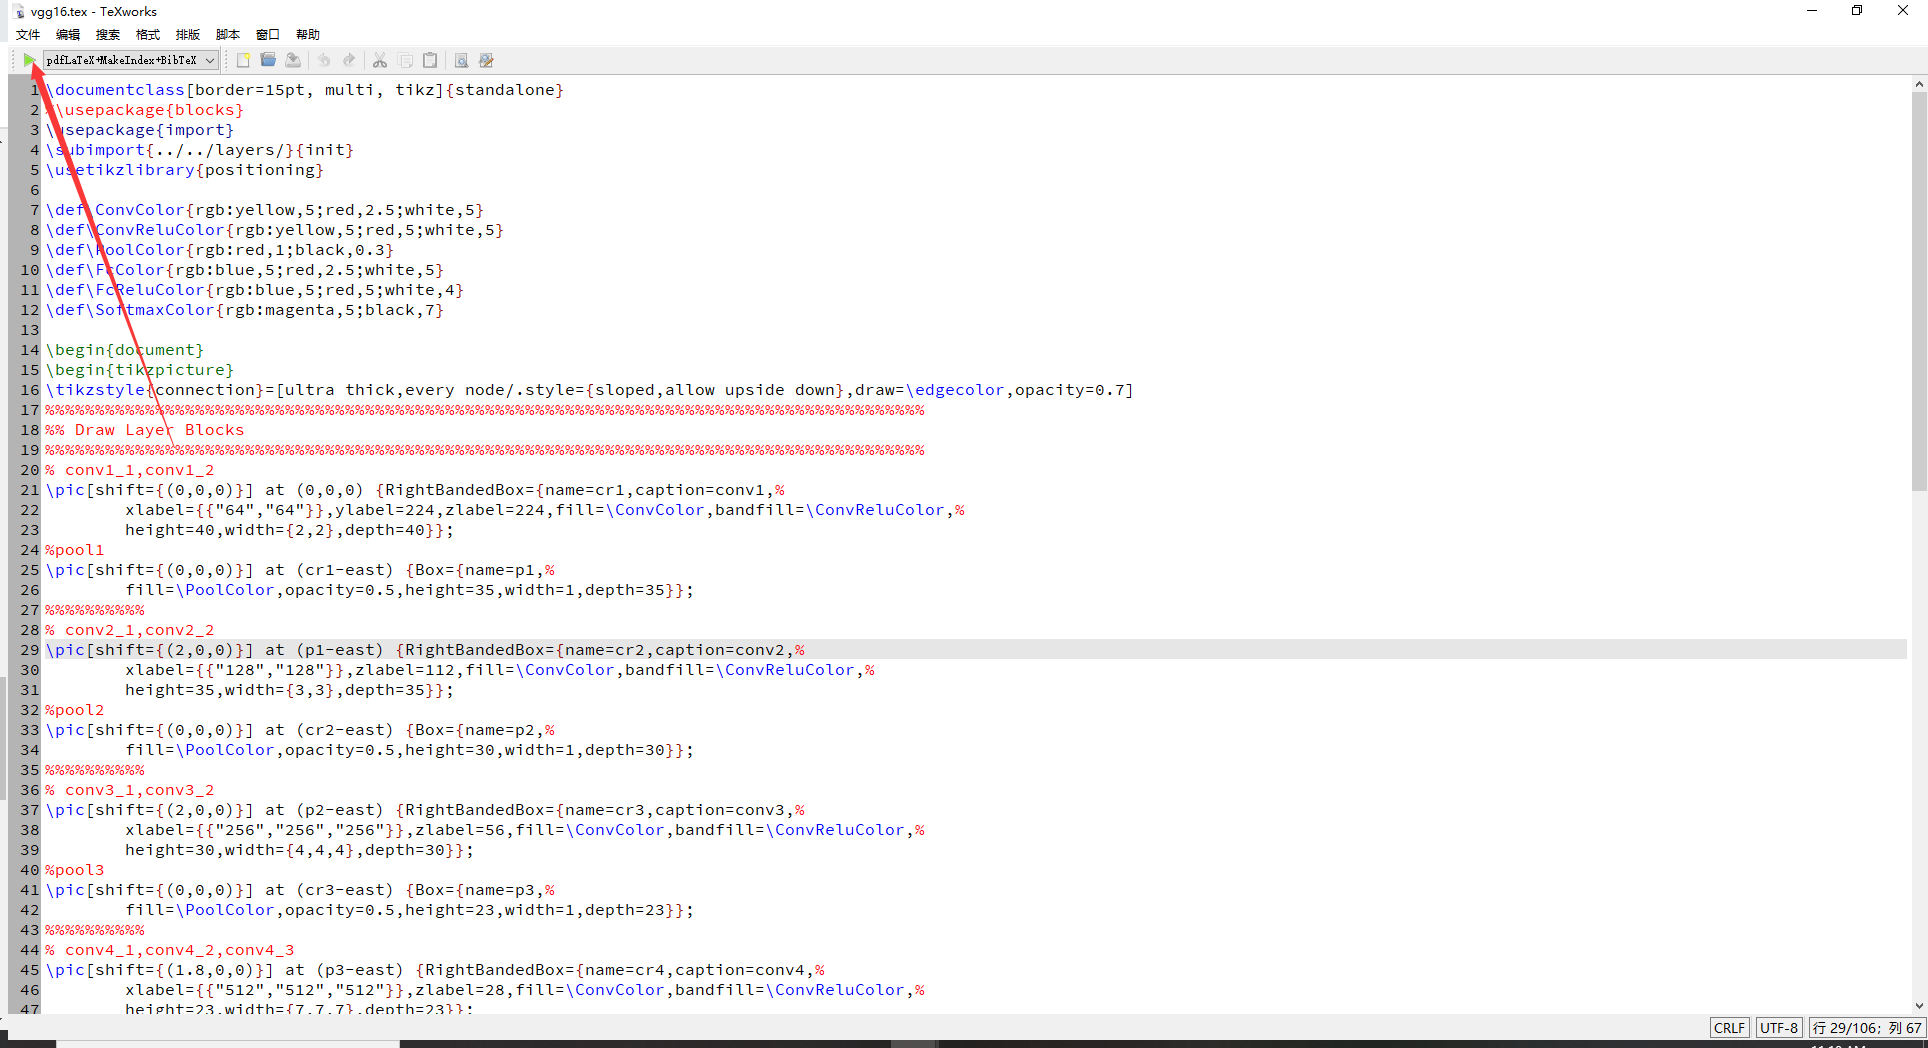
打开后直接点击运行按钮,稍等一会,就可以看到渲染的图像就出来了。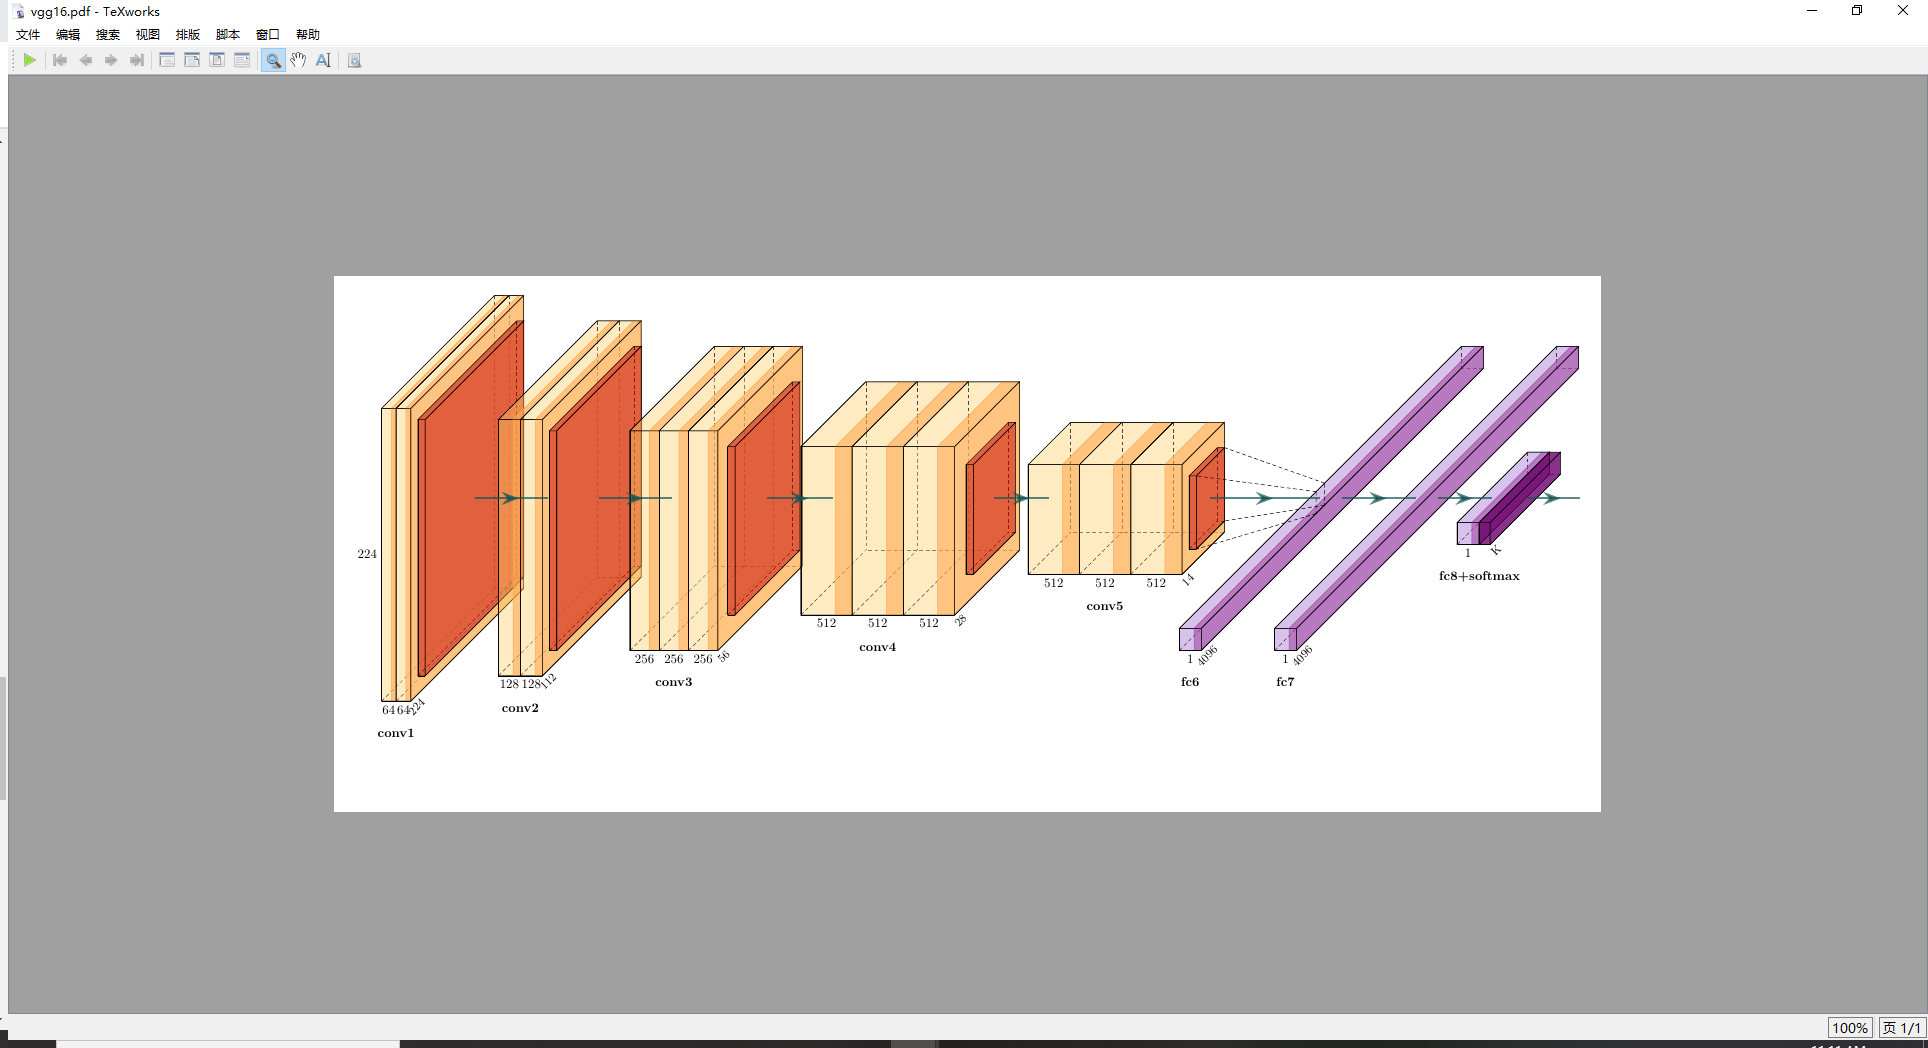
下面我们就开始修改源码以适应自己的需求。
我们以这个网络为例子:
self.conv1 = nn.Conv2d(4, 32, 3, stride=2, padding=1)
self.conv2 = nn.Conv2d(32, 32, 3, stride=2, padding=1)
self.conv3 = nn.Conv2d(32, 32, 3, stride=2, padding=1)
self.conv4 = nn.Conv2d(32, 32, 3, stride=2, padding=1)

# The output image size is calculated through
# (I - K + 2*P) / S + 1
# where: I : image size, the initial image size is 84x84, so I == 84 here.
#        K : kernel size, here is 3
#        P : padding size, here is 1
#        S : stride, here is 2
# So 84x84 image will become 6x6 through the ConvNet above. And 32 is the filters number.
self.fc1 = nn.Linear(32 * 6 * 6, 512)
self.fc_out = nn.Linear(512, 3)
我们先看一下最终的效果: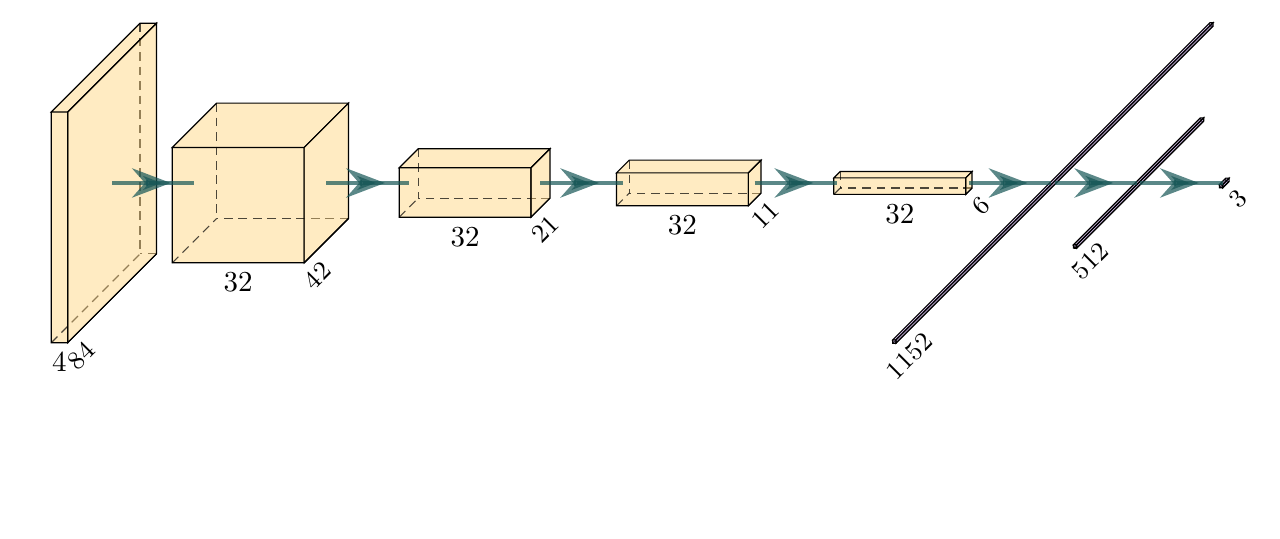
那这个要怎么实现呢?
首先,这个的网络结构和lenet是比较相似的,所以我们使用example中的lenet.tex的源码作为基础进行修改。整个代码也很简单,这里就不讲解具体每行代码是干什么的了,相信各位读者仔细读一下源码都可以搞清楚该怎么使用这个模板来编写自己的网络结构。
上图网络的源码如下:
\documentclass[border=8pt, multi, tikz]{standalone}
\usepackage{import}
\subimport{../../layers/}{init}
\usetikzlibrary{positioning}
\usetikzlibrary{3d} %for including external image

\def\ConvColor{rgb:yellow,5;red,2.5;white,5}
\def\ConvReluColor{rgb:yellow,5;red,5;white,5}
\def\PoolColor{rgb:red,1;black,0.3}
\def\UnpoolColor{rgb:blue,2;green,1;black,0.3}
\def\FcColor{rgb:blue,5;red,2.5;white,5}
\def\FcReluColor{rgb:blue,5;red,5;white,4}
\def\SoftmaxColor{rgb:magenta,5;black,7}

\newcommand{\copymidarrow}{\tikz \draw[-Stealth,line width=0.8mm,draw={rgb:blue,4;red,1;green,1;black,3}] (-0.3,0) -- ++(0.3,0);}

\begin{document}
\begin{tikzpicture}
\tikzstyle{connection}=[ultra thick,every node/.style={sloped,allow upside down},draw=\edgecolor,opacity=0.7]
\tikzstyle{copyconnection}=[ultra thick,every node/.style={sloped,allow upside down},draw={rgb:blue,4;red,1;green,1;black,3},opacity=0.7]

\pic[shift={(0,0,0)}] at (0,0,0)
    {Box={
        name=conv0,
        caption= ,
        xlabel={{4, }},
        zlabel=84,
        fill=\ConvColor,
        height=14,
        width=1,
        depth=14
        }
    };


\pic[shift={(1,0,0)}] at (conv0-east)
    {Box={
        name=conv1,
        caption= ,
        xlabel={{32, }},
        zlabel=42,
        fill=\ConvColor,
        height=7,
        width=8,
        depth=7
        }
    };


\draw [connection]  (conv0-east)    -- node {\midarrow} (conv1-west);


\pic[shift={(1,0,0)}] at (conv1-east)
    {Box={
        name=conv2,
        caption= ,
        xlabel={{32, }},
        zlabel=21,
        fill=\ConvColor,
        height=3,
        width=8,
        depth=3
        }
    };


\draw [connection]  (conv1-east)    -- node {\midarrow} (conv2-west);


\pic[shift={(1,0,0)}] at (conv2-east)
    {Box={
        name=conv3,
        caption= ,
        xlabel={{32, }},
        zlabel=11,
        fill=\ConvColor,
        height=2,
        width=8,
        depth=2
        }
    };


\draw [connection]  (conv2-east)    -- node {\midarrow} (conv3-west);


\pic[shift={(1,0,0)}] at (conv3-east)
    {Box={
        name=conv4,
        caption= ,
        xlabel={{32, }},
        zlabel=6,
        fill=\ConvColor,
        height=1,
        width=8,
        depth=1
        }
    };


\draw [connection]  (conv3-east)    -- node {\midarrow} (conv4-west);

\pic[shift={(1,0,0)}] at (conv4-east)
    {Box={
        name=conv5,
        caption= ,
        xlabel={{, }},
        zlabel=1152,
        fill=\FcColor,
        height=0.2,
        width=0.2,
        depth=50
        }
    };

\draw [connection]  (conv4-east)    -- node {\midarrow} (conv5-west);

\pic[shift={(1,0,0)}] at (conv5-east)
    {Box={
        name=conv6,
        caption= ,
        xlabel={{, }},
        zlabel=512,
        fill=\FcColor,
        height=0.2,
        width=0.2,
        depth=20
        }
    };

\draw [connection]  (conv5-east)    -- node {\midarrow} (conv6-west);

\pic[shift={(1,0,0)}] at (conv6-east)
    {Box={
        name=conv7,
        caption= ,
        xlabel={{, }},
        zlabel=3,
        fill=\FcColor,
        height=0.2,
        width=0.2,
        depth=1
        }
    };

\draw [connection]  (conv6-east)    -- node {\midarrow} (conv7-west);


\end{tikzpicture}
\end{document}
请注意其中的数值,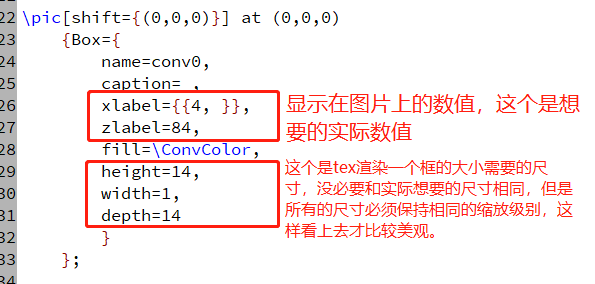
我是同时都缩放了6倍,即渲染框尺寸的数值是想要数值的1/6。至于不缩放也是完全可以的。


评论(3)
您还未登录,请登录后发表或查看评论