

1.需求
- 给定一个二维数组 100行, 5列, 每一列绘制一条折线, 横轴为行索引, 纵轴为对应位置的值, 绘制在一个子图里面, 使用python plot,
- 使用随机颜色进行区别
- 添加显示和隐藏按钮, 可以对每条折线进行显示和隐藏
2.代码
import numpy as np
import matplotlib.pyplot as plt
from matplotlib.widgets import CheckButtons
from matplotlib.patches import Circle

# 生成一个包含100行、5列的随机二维数组
data = np.random.rand(100, 5)

# 创建图形对象
fig, ax = plt.subplots(figsize=(10, 6))

# 对每一列数据绘制折线图,并使用随机颜色
lines = []
for i in range(5):
    line, = ax.plot(data[:, i], label=f'Line {i+1}', color=np.random.rand(3,))
    lines.append(line)

# 设置图例、标题和坐标轴标签
ax.legend()
ax.set_title('Line Plots of 5 Columns')
ax.set_xlabel('Row Index')
ax.set_ylabel('Value')

# 创建显示和隐藏按钮,自定义按钮样式
rax = plt.axes([0.05, 0.5, 0.1, 0.4], frameon=False)
check = CheckButtons(rax, [f'Line {i+1}' for i in range(5)], [True] * 5)

# 定义按钮点击事件处理函数
def toggle_visibility(label):
    index = int(label.split()[-1]) - 1
    lines[index].set_visible(not lines[index].get_visible())
    plt.draw()

check.on_clicked(toggle_visibility)

# 创建按钮的圆形样式
button_circles = []
for i, label in enumerate(check.labels):
    circle = Circle((0.5, 0.5 - i * 0.1), 0.03, color='gray', transform=rax.transAxes, visible=True)
    ax.add_patch(circle)
    button_circles.append(circle)

# 定义按钮点击事件处理函数,切换小圆点的可见性
def toggle_circle(event):
    for circle, line in zip(button_circles, lines):
        if line.get_visible():
            circle.set_visible(True)
        else:
            circle.set_visible(False)
    plt.draw()

toggle_circle(None)

# 注册按钮点击事件处理函数
check.on_clicked(toggle_circle)

# 显示图形
plt.grid(True)
plt.show()
3.效果
全部显示: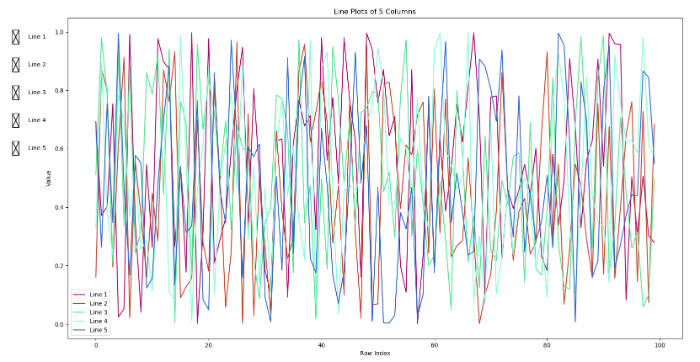
只显示指定的折线: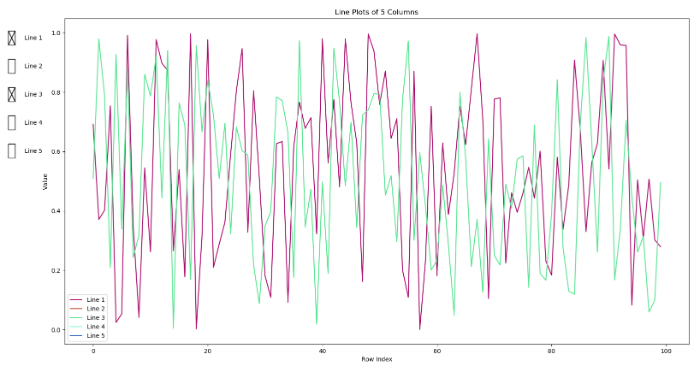


评论(0)
您还未登录,请登录后发表或查看评论