
evo是一款用于视觉里程计和slam问题的轨迹评估工具。核心功能是能够绘制相机的轨迹,或评估估计轨迹与真值的误差。支持多种数据集的轨迹格式(TUM、KITTI、EuRoC MAV、ROS的bag),同时支持这些数据格式之间进行相互转换。在此仅对其基本的绘图功能和ROS map轨迹绘制做简要总结。
官方文档地址: Plotting · MichaelGrupp/evo Wiki · GitHub ,文档中英互译
目录
Example configuration for print-quality plots
1. Set the plot grid and background 设置绘图的网格和背景
2. Set the font type and scale 设置字体类型和比例
3. Set the default figure size 3. 设置默认图形大小
4. Use LaTeX renderer 使用 LaTeX 渲染器
1. Plotting 绘图工具
There are several settings that allow you to change the appearance of plots.
有几个设置允许您更改图表的外观。
In the command line apps, take a look at parameters like --plot, --plot_mode etc. More general, package-wide settings can be set via evo_config set (see "Configuration" section). Have a look at evo_config show to see all available settings and their current values.
在命令行应用程序中,查看 -- plot、 -- plot 模式等参数。 更一般的是,可以通过 evo 配置集(参见“ Configuration”部分)设置包范围的设置。 查看 evo 的配置显示,可以看到所有可用的设置及其当前值。
Example configuration for print-quality plots
打印质量图的示例配置
This is an example walkthrough for how you could theoretically change the plot settings to produce high-quality plots for print (thesis, paper...).
这是一个示例演练,说明如何从理论上改变情节设置,以生成高质量的打印图(论文,论文...)。
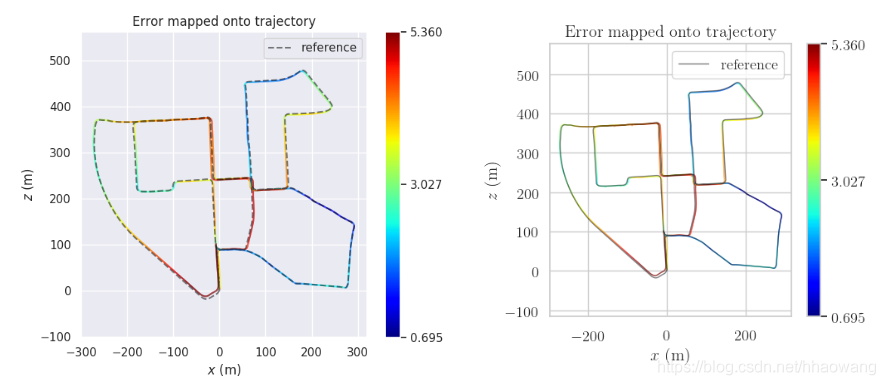
1. Set the plot grid and background 设置绘图的网格和背景
The default plot settings have a dark background. This looks good on the screen, but is not suitable for printing. We can change the background to a grid with white background by changing the style parameter of Seaborn with:
默认情节设置有一个黑色的背景。 这在屏幕上看起来不错,但不适合印刷。 我们可以通过改变 Seaborn 的样式参数来改变背景为白色背景的网格:
evo_config set plot_seaborn_style whitegrid2. Set the font type and scale 设置字体类型和比例
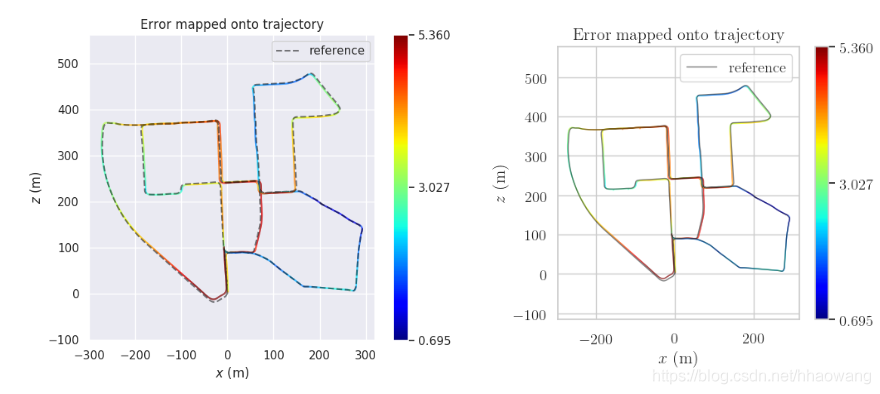
The default font doesn't really fit to the rest of our paper, which uses a serif font. The relative size of the text labels in the plot figure could also be increased for better readability. We can switch to a serif font with larger scale by calling:
默认字体不适合我们文章的其余部分,因为文章使用了衬线字体。 图形中文本标签的相对大小也可以增加,以提高可读性。 我们可以通过调用:
evo_config set plot_fontfamily serif plot_fontscale 1.2
To match the smaller font, we also reduce the line width:
为了匹配较小的字体,我们还缩小了行宽:
evo_config set plot_linewidth 1.0
There are some other things you can change, for example the line style of the reference trajectory:
还有一些其他的东西你可以改变,例如参考轨迹的线条样式:
evo_config set plot_reference_linestyle -
3. Set the default figure size 3. 设置默认图形大小
You can adjust the default plot figure size, too. For example to a width of 5 and a height of 4.5:
您还可以调整默认的绘图图形大小。 例如,宽度为5,高度为4.5:
evo_config set plot_figsize 5 4.54. Use LaTeX renderer 使用 LaTeX 渲染器
Because we use LaTeX to write the paper, we want to render the fonts of the plots with LaTeX, too:
因为我们使用 LaTeX 来写论文,所以我们也想使用 LaTeX 来渲染图中的字体:
evo_config set plot_usetex
You may need to change the plot_texsystem parameter to the LaTeX system that's installed on your machine if this doesn't work on the first try, see evo_config show.
您可能需要将 plot texsystem 参数更改为机器上安装的 LaTeX 系统,如果这在第一次尝试时不起作用,请参见 evo config show。
Advanced: plots can be also exported (--save_plot) in pgf format: evo_config set plot_export_format pgf.
也可以以 pgf 格式导出(-- save plot) : evo config set plot export format pgf。
5. Restore default settings
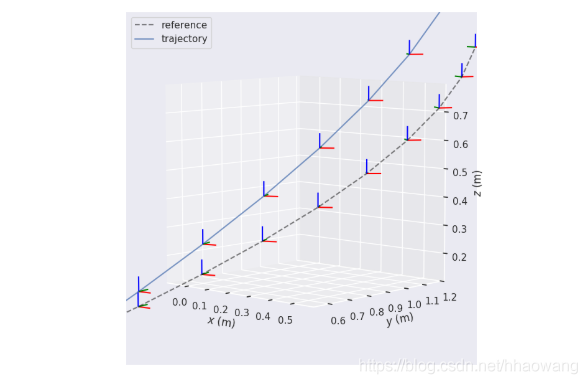
evo_config resetCoordinate axis markers 坐标系标注
Coordinate axis markers can be activated by setting plot_axis_marker_scale to a non-zero value, for example:
坐标轴标记可以通过将地图坐标轴标记比例设置为非零值来激活,例如:
evo_config set plot_axis_marker_scale 0.1
You probably need to play around with this scale value to adjust it to the size of your trajectories. Set it to 0 again if you don't need it anymore.
你可能需要调整这个比例值来调整它以适应你轨迹的大小。 如果你不再需要它,再次设置为0。
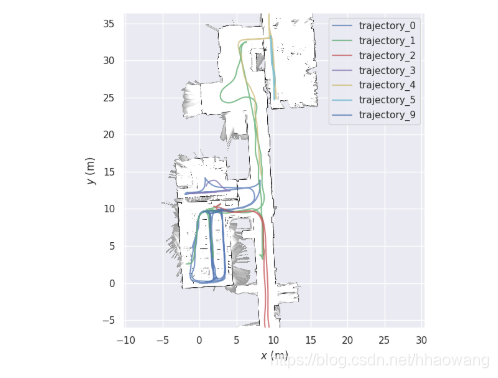
2D ROS maps - 2D ROS地图绘制
You can insert 2D maps that follow the ROS map_server format into plots. The format is described here: map_server - ROS Wiki
你可以按照 ROS 地图服务器的格式将2 d 地图插入到绘图中,这里描述了这种格式: http://wiki.ROS.org/map_server#map_format 地图
Given that you have such a pair of files (map.pgm and map.yaml), just add --ros_map_yaml map.yamland the map will be shown in addition to the trajectories:
如果你有这样一对文件(map.pgm 和 map.yaml) ,只需添加 -- ros 映射 yaml map.yaml,这个映射将显示在轨迹之外:
Note that this follows the ROS convention:
请注意,这符合 ROS 约定:
-
the map is assumed to be in the x-y plane, so it will be only shown in the xy/yx plot modes
-
地图假设在 x-y 平面上,所以它只显示在 xy / yx 绘图模式中
-
the image will be transformed to the x-y plane's origin as specified in the .yaml file
-
图像将被转换为在.yaml 文件中指定的 x-y 平面的原点
In the above image the unknown cells of the map grid are not shown. To make this work, you might have to tweak the setting for the uint8 value that represents unknown cells in a ROS map image. ROS' standard map_saver uses 205, other tools might not (for example, Cartographer uses 128 for images of probability grids):
在上面的图像中,地图网格的未知单元没有显示。 要做到这一点,您可能需要调整 uint8值的设置,该值表示 ROS 映射图像中的未知细胞。 Ros 的标准地图保护程序使用205,其他工具可能不使用(例如,使用128的概率网格图像) :
evo_config set ros_map_unknown_cell_value 128
But this can also be completely disabled. Then the bounding box of the map will be visible.
但是这也可以完全禁用,这样地图的边界框就可以看到了。
evo_config set ros_map_unknown_cell_value false


评论(0)
您还未登录,请登录后发表或查看评论