

文章目录
ESP32 IDF开发调试奇技淫巧
- 查询系统剩余堆/最小堆大小
- 查询线程剩余栈大小
2.1 方案一
2.2 方案二 - 查询CPU占用率
- 查询APP版本信息
4.1 设置 APP 版本
4.2 读取 APP 版本 - Backtrace奔溃分析
- 相关文章推荐
ESP32 IDF开发调试奇技淫巧
基于 IDF 5.0.2 版本,其他版本可能略有不同,需注意
1. 查询系统剩余堆/最小堆大小
查询系统剩余堆、最小堆大小的 API 位于 esp_system 组件中。剩余堆大小过小,会导致 malloc 申请内存失败,当剩余堆不够时,很多网络操作均会失败,这是由于网路操作内部涉及很多 malloc 操作。
- 查询系统剩余堆大小,返回值为 Byte
uint32_t esp_get_free_heap_size( void ); - 查询系统最小堆大小,返回值为 Byte
示例:uint32_t esp_get_minimun_free_heap_size(void);while (1) { remain_heap = esp_get_free_heap_size() / 1024; ESP_LOGW(TAG, "Remaining heap tight:%lu k", remain_heap); vTaskDeley(300); }
2. 查询线程剩余栈大小
2.1 方案一
由于ESP32 IDF采用FreeRTOS,因此查询线程所使用的栈大小空间,可通过FreeRTOS API实现,函数原型如下:
UBaseType_t uxTaskGetStackHighWaterMark( TaskHandle_t xTask );
返回值为线程栈使用的高水位线,所谓高水位线也即自任务开始运行以来,任务所使用的栈最大时所剩余的栈大小。因此此值越大,代表线程峰值栈剩余量越大。
示例:
#include <stdio.h>
#include "freertos/FreeRTOS.h"
#include "freertos/task.h"
void task_function(void *pvParameter) {
    int stack_left = 0;
    stack_left = uxTaskGetStackHighWaterMark(NULL);
    printf("Stack left: %d bytes\n", stack_left);
    while (1) {
        char c[1000] = {0};
        stack_left = uxTaskGetStackHighWaterMark(NULL);
        printf("Stack left: %d bytes\n", stack_left);
        vTaskDelay(100);
    }
    // 线程结束
    vTaskDelete(NULL);
}
int app_main(void)
{
    xTaskCreate(task_function, "task", 4096, NULL, 1, NULL);
    vTaskDelete(NULL);
}
2.2 方案二
使用 vTaskList() 查看,函数原型
void vTaskList( char * pcWriteBuffer );
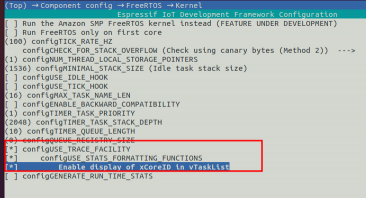
使用此函数需先配置 menuconfig 打开部分功能:
- idf menuconfig → Component config → FreeRTOS → kernel→Enable FreeRTOS trace facility
- idf menuconfig → Component config → FreeRTOS → kernel→Enable FreeRTOS trace facility → Enable FreeRTOS stats formatting functions
- idf menuconfig → Component config → FreeRTOS → kernel→Enable FreeRTOS trace facility → Enable display of xCoreID in vTaskList
示例:#include <stdio.h> #include "freertos/FreeRTOS.h" #include "freertos/task.h" #include <string.h> void task_function(void *pvParameter) { uint8_t CPU_RunInfo[400]; while (1) { memset(CPU_RunInfo, 0, 400); vTaskList((char *)&CPU_RunInfo); printf("----------------------------------------------------\r\n"); printf("task_name status priority stack num core\r\n"); printf("%s", CPU_RunInfo); printf("----------------------------------------------------\r\n"); vTaskDelay(500 / portTICK_PERIOD_MS); } } int app_main(void) { xTaskCreate(task_function, "task", 4096, NULL, 1, NULL); vTaskDelete(NULL); }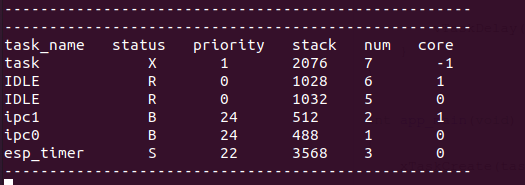
- 第一列,任务名称
-
第二列,任务状态
X: running
B: blocked
R: ready
D: deleted
S: suspended -
第三列,任务优先级
数值越大,优先级越高 -
第四列,任务栈
数值越大,代表剩余的任务栈空间越大,单位Byte
注意此值为当前剩余栈大小,而不是峰值剩余栈大小 -
第五列,任务号
代表任务创建顺序 -
第六列,任务内核
代表任务所在内核ID
3. 查询CPU占用率
esp32 idf查询任务 CPU 占用率,依旧可以通过FreeRTOS的任务统计功能来实现,函数原型如下:
void vTaskGetRunTimeStats( char * pcWriteBuffer );
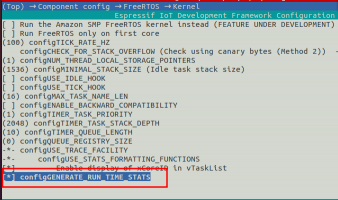
配置menuconfig 打开:
- idf.py menuconfig → Component config → FreeRTOS → Kernel → configGENERATE_RUN_TIME_STATS
示例如下:#include <stdio.h> #include "freertos/FreeRTOS.h" #include "freertos/task.h" #include <string.h> void task_function(void *pvParameter) { uint8_t CPU_RunInfo[400]; while (1) { memset(CPU_RunInfo, 0, 400); vTaskGetRunTimeStats((char *)&CPU_RunInfo); printf("task_name run_cnt usage_rate \r\n"); printf("%s", CPU_RunInfo); printf("----------------------------------------------------\r\n"); vTaskDelay(500 / portTICK_PERIOD_MS); } } int app_main(void) { xTaskCreate(task_function, "task", 4096, NULL, 1, NULL); vTaskDelete(NULL); }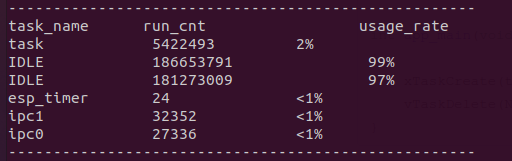
4. 查询APP版本信息
在ESP32 IDF 中 APP程序的版本不用我们自己再定义数组去构造,IDF已经帮我们设计好了,我们直接使用即可。4.1 设置 APP 版本
在工程目录下,配置 IDF menuconfig 选项 - idf.py menuconfig → Application manager → Get the project version from Kconfig 配置使能
- idf.py menuconfig → Application manager → Project version 设置软件版本
注意此处设置的软件版本为字符串格式!
4.2 读取 APP 版本
读取 APP 版本信息接口位于 esp_app_format 组件中,需包含#include “esp_app_desc.h”头文件,API 函数接口如下:
const esp_app_desc_t *esp_app_get_description(void);
返回值为 esp_app_desc_t 类型结构体,其中 version 成员即为我们设置的版本信息
/**
 * @brief Description about application.
 */
typedef struct {
    uint32_t magic_word;        /*!< Magic word ESP_APP_DESC_MAGIC_WORD */
    uint32_t secure_version;    /*!< Secure version */
    uint32_t reserv1[2];        /*!< reserv1 */
    char version[32];           /*!< Application version */
    char project_name[32];      /*!< Project name */
    char time[16];              /*!< Compile time */
    char date[16];              /*!< Compile date*/
    char idf_ver[32];           /*!< Version IDF */
    uint8_t app_elf_sha256[32]; /*!< sha256 of elf file */
    uint32_t reserv2[20];       /*!< reserv2 */
} esp_app_desc_t;
示例:
#include <stdio.h>
#include "esp_app_desc.h"
int app_main(void)
{
    const esp_app_desc_t *running_app_info = NULL;
    running_app_info = esp_app_get_description();
    printf("version:%s\n", running_app_info→version);
    esp_restart();
}
5. Backtrace奔溃分析
当我们的代码发生内存泄露的时候会触发Backtrace奔溃,如果我们是在工程目录下使用监视器 idf.py monitor 调试工程,由于监视器会加载对应工程的 .elf 文件,因此当出现奔溃的时候能从串口日志上看到具体在哪一行奔溃,如下所示:
示例代码如下:
/*
 * SPDX-FileCopyrightText: 2010-2022 Espressif Systems (Shanghai) CO LTD
 *
 * SPDX-License-Identifier: CC0-1.0
 */
#include <stdio.h>
#include <inttypes.h>
#include "sdkconfig.h"
#include "freertos/FreeRTOS.h"
#include "freertos/task.h"
#include "esp_chip_info.h"
#include "esp_flash.h"
#include "esp_app_desc.h"
#include <string.h>
int test_b(void)
{
    char p[2] ={0};
    for (int i = 0; i < 5; i++) {
        p[i] = 'a';
        printf("%c ", p[i]);
    }
    printf('\n');
    return 0;
}
int test_a(void)
{
    return test_b();
}
void task_function(void *pvParameter) {
    printf("task fun run!\n");
    test_a();
    vTaskDelete(NULL);
}
void app_main(void)
{
    printf("Hello world!\n");
    /* Print chip information */
    esp_chip_info_t chip_info;
    uint32_t flash_size;
    esp_chip_info(&chip_info);
    printf("This is %s chip with %d CPU core(s), WiFi%s%s, ",
           CONFIG_IDF_TARGET,
           chip_info.cores,
           (chip_info.features & CHIP_FEATURE_BT) ? "/BT" : "",
           (chip_info.features & CHIP_FEATURE_BLE) ? "/BLE" : "");
    unsigned major_rev = chip_info.revision / 100;
    unsigned minor_rev = chip_info.revision % 100;
    printf("silicon revision v%d.%d, ", major_rev, minor_rev);
    if(esp_flash_get_size(NULL, &flash_size) != ESP_OK) {
        printf("Get flash size failed");
        return;
    }
    printf("%" PRIu32 "MB %s flash\n", flash_size / (uint32_t)(1024 * 1024),
           (chip_info.features & CHIP_FEATURE_EMB_FLASH) ? "embedded" : "external");
    const esp_app_desc_t *running_app_info = NULL;
    running_app_info = esp_app_get_description();
    printf("version:%s\n", running_app_info->version);
    xTaskCreate(task_function, "task", 4096, NULL, 1, NULL);
    while (1) {
        printf("Minimum free heap size: %" PRIu32 " bytes\n", esp_get_minimum_free_heap_size());
        vTaskDelay(1000 / portTICK_PERIOD_MS);
    }
    fflush(stdout);
    // esp_restart();
    vTaskDelete(NULL);
}
在此代码中 test_b() 函数内 char p[2] 的使用存在溢出使用的情况,因此当代码运行的时候,会出现奔溃,idf.py monitor 打印的信息如下:
I (286) spi_flash: detected chip: generic
I (290) spi_flash: flash io: dio
W (294) spi_flash: Detected size(16384k) larger than the size in the binary image header(2048k). Using the size in the binary image header.
I (308) cpu_start: Starting scheduler on PRO CPU.
I (0) cpu_start: Starting scheduler on APP CPU.
Hello world!
This is esp32 chip with 2 CPU core(s), WiFi/BT/BLE, silicon revision v3.0, 2MB external flash
version:1.0.0
Minimum free heap size: 297268 bytes
task fun run!
Guru Meditation Error: Core  0 panic'ed (LoadProhibited). Exception was unhandled.
Core  0 register dump:
PC      : 0x400db91e  PS      : 0x00060630  A0      : 0x800d79a8  A1      : 0x3ffb6430
0x400db91e: _vfprintf_r at ??:?
A2      : 0x00000000  A3      : 0x0000000a  A4      : 0x00000000  A5      : 0x00000000
A6      : 0x3ffb6750  A7      : 0x00000004  A8      : 0x3ffaeb44  A9      : 0x3ffb6624
A10     : 0x3ffaecd8  A11     : 0x3ffb6684  A12     : 0x000000ff  A13     : 0x0000ff00
A14     : 0x3ffb6440  A15     : 0xff000000  SAR     : 0x00000000  EXCCAUSE: 0x0000001c
EXCVADDR: 0x0000000a  LBEG    : 0x400014fd  LEND    : 0x4000150d  LCOUNT  : 0xffffffff
Backtrace: 0x400db91b:0x3ffb6430 0x400d79a5:0x3ffb6740 0x400d539f:0x3ffb6790 0x400d53ab:0x3ffb67c0 0x400d53bd:0x3ffb67e0 0x40088061:0x3ffb6800
0x400db91b: _vfprintf_r at ??:?
0x400d79a5: printf at /builds/idf/crosstool-NG/.build/xtensa-esp32-elf/src/newlib/newlib/libc/stdio/printf.c:56 (discriminator 5)
0x400d539f: test_b at /home/wl/workspace/esp32/debug/build/../main/hello_world_main.c:25
0x400d53ab: test_a at /home/wl/workspace/esp32/debug/build/../main/hello_world_main.c:32
0x400d53bd: task_function at /home/wl/workspace/esp32/debug/build/../main/hello_world_main.c:37
0x40088061: vPortTaskWrapper at /home/wl/esp/esp-idf/components/freertos/FreeRTOS-Kernel/portable/xtensa/port.c:154
ELF file SHA256: 0fa1c59393ad5e27
Rebooting...
ets Jul 29 2019 12:21:46
Backtrace也就是在代码发生奔溃复位之前,将处理器的栈数据进行输出,从而通过栈数据结合对应代码的.elf文件即可看到奔溃之前的函数调用情况,以上奔溃日志中可以直观的看到奔溃发生在 test_b 函数内的 printf 函数上。
而实际使用中,运行的代码不可能都是接着调试器在工程目录下跑,因此通常无法与工程的.elf文件结合,但是在奔溃前的栈数据依旧会通过串口打印出来,如以下即直接采用串口监控到设备奔溃请的日志(采用以上相同代码)
W (294) spi_flash Detected size(16384k) larger than the size in the binary image header(2048k). Using the size in the binary image header.
I (308) cpu_start Starting scheduler on PRO CPU.
I (0) cpu_start Starting scheduler on APP CPU.
Hello world!
This is esp32 chip with 2 CPU core(s), WiFiBTBLE, silicon revision v3.0, 2MB external flash
version1.0.0
Minimum free heap size 297268 bytes
task fun run!
Guru Meditation Error Core  0 panic'ed (LoadProhibited). Exception was unhandled.
Core  0 register dump
PC       0x400db91e  PS       0x00060630  A0       0x800d79a8  A1       0x3ffb6430
A2       0x00000000  A3       0x0000000a  A4       0x00000000  A5       0x00000000
A6       0x3ffb6750  A7       0x00000004  A8       0x3ffaeb44  A9       0x3ffb6624
A10      0x3ffaecd8  A11      0x3ffb6684  A12      0x000000ff  A13      0x0000ff00
A14      0x3ffb6440  A15      0xff000000  SAR      0x00000000  EXCCAUSE 0x0000001c
EXCVADDR 0x0000000a  LBEG     0x400014fd  LEND     0x4000150d  LCOUNT   0xffffffff
Backtrace 0x400db91b:0x3ffb6430 0x400d79a5:0x3ffb6740 0x400d539f:0x3ffb6790 0x400d53ab:0x3ffb67c0 0x400d53bd:0x3ffb67e0 0x40088061:0x3ffb6800
ELF file SHA256 0fa1c59393ad5e27
没有了idf.py monitor 可以看到Backtrace就是一串看不懂的数字,那么如何通过此奔溃代码查看具体是哪里发生的奔溃呢?
方法是有的,我们只需要将此 Backtrace 与对应工程的 .elf 结合,通过工具xtensa-esp32-elf-addr2line就可以分析了。
命令如下:
xtensa-esp32-elf-addr2line -pfiaC -e <工程.elf路径> <Backtrace 内容>
此处,我们进入工程目录,输入以下命令:
xtensa-esp32-elf-addr2line -pfiaC -e ./build/debug_test.elf 0x400db91b:0x3ffb6430 0x400d79a5:0x3ffb6740 0x400d539f:0x3ffb6790 0x400d53ab:0x3ffb67c0 0x400d53bd:0x3ffb67e0 0x40088061:0x3ffb6800
可查阅到对应的奔溃函数,需要注意的是务必确认结合的 .elf 为实际奔溃的工程的 .elf 文件
创作不易,转载请注明出处!
关注、点赞+收藏,可快速查收博主有关分享!


评论(0)
您还未登录,请登录后发表或查看评论